Interactive Stock Charts 2.86
Free Version
Publisher Description
Interactive Stock Charts - The most powerful and intuitive stock charting program!
Annoucement: v2.81 includes new data source for AlphaVantage for international market data.
New!! Candlestick Pattern Scanner and Indicator Reliability Lab added to allow Instant backtesting!
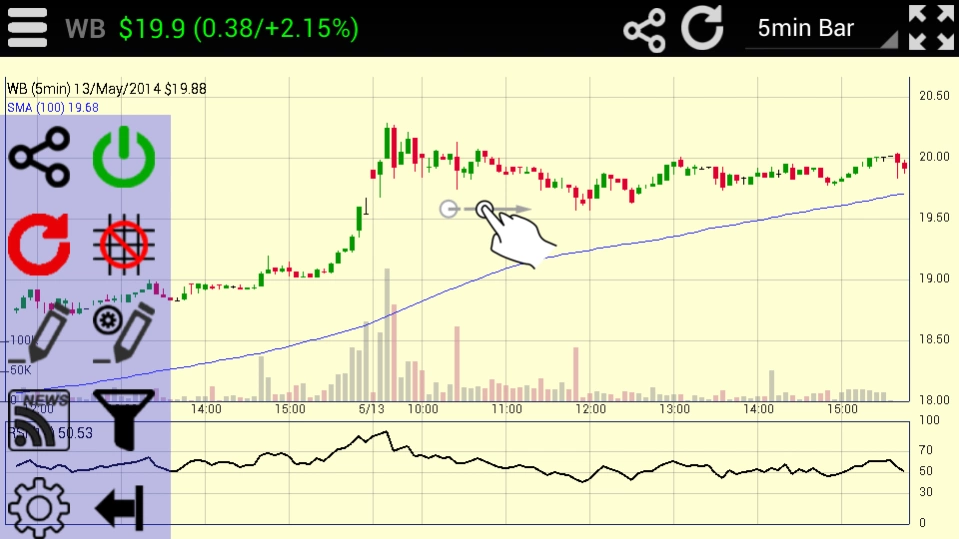
Interactive Stock Charts © is the most intuitive and advanced stock analysis charting app. You can freely adjust time frame and view technical information with touch of finger: scroll, pan and zoom on a beautiful candlestick charts with gesture and touch control. Swipe to scroll into historical analysis, pinch to zoom and change time frame, touch on price points to show detailed quotes and technical indicator values. You can also place real trade orders directly from the charts and portfolio view, through our partner Tradier Brokerage for US equity and options. Backed by Screenulator's patent pending automated chart pattern and trendline recognition engine, and industry's first 9,13 indicator completion screener! Interactive Stock Charts also comes with a powerful technical analysis tool set, Indicator Reliability Lab - in-chart backtesting tool and realtime RSS news feed to give you an edge over the market!
Using AI-based Deep Learning Neural Networks algorithms, Screenulator detects highly proftable chart patterns and reliable trendlines, TR/TD Indicators signals, as well as candlestick patterns. Backtested with 50+ years of historical big data, it ensures the you always have an edge against increasingly unpredictable markets! All Screenulator chart patterns are available on www.screenulator.com website for existing subscribers, see website for more member benefits.
Recent Additions:
Candlestick Pattern Scanner: http://www.screenulator.com/show_video.php?id=-XCcw46omgs
Indicator Reliability Lab:
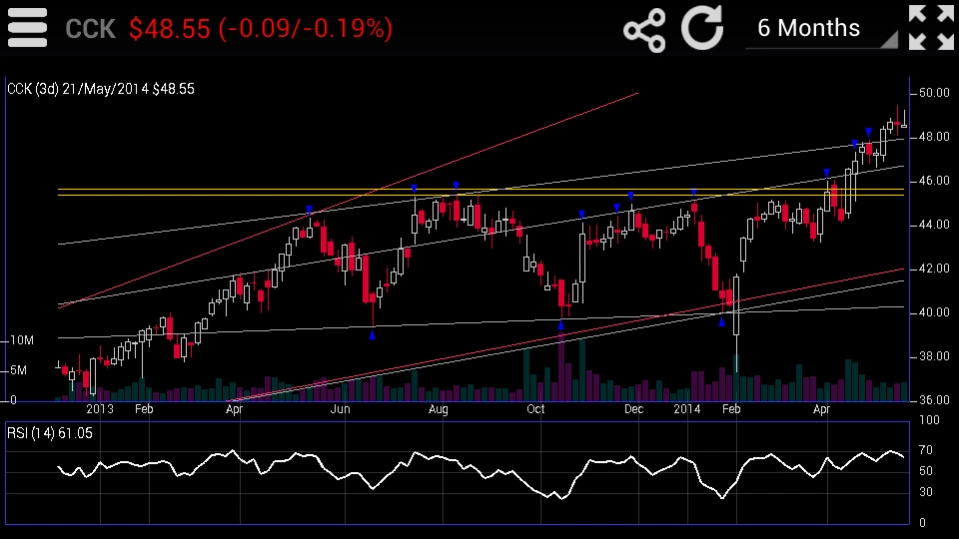
About Trendlines:
A trend line is a bounding line for the price movement of a security. A support trend line (or a bottom line) is formed when a securities price decreases and then rebounds at a pivot point that aligns with at least two previous support pivot points. Trendlines are considered by many expert traders to be the single most important tools in technical analysis. However, Support and Resistance breakout and Triangle patterns are just example of patterns formed by trendlines. This app automatically draws and screens for stocks with specific patterns.To learn more: http://www.screenulator.com/cgi-bin/v?pid=ref#trendlines
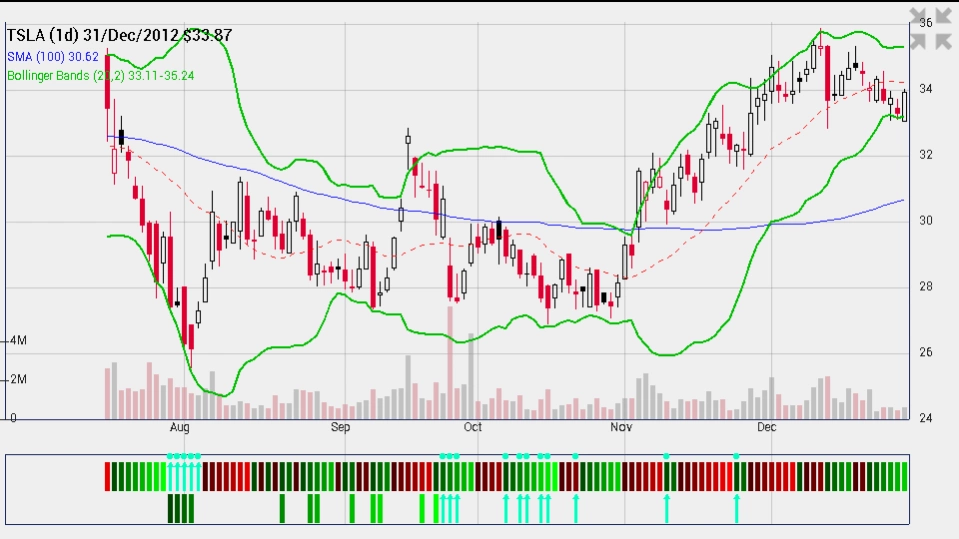
About Trend Reversal Indicator:
Screenulator's patent pending Trend Reversal and Exhaustion indicators combines 9,13 counting with trendline analysis to pinpoint trend pivots with color coded visual indicator. It has been shown to have an impressive record of identifying and anticipating turning points across the FX, bond, equity and commodity markets. Furthermore, the indicators provide signals not only on a daily chart but also intraday. It identifies when a trend is becoming, or has become, exhausted. This apps automatically identifies Trend Reversal, Trend Exhaustion, and Perfection criteria. It also calculates stoploss levels. To learn more: http://www.screenulator.com/show_video.php?id=TR_EXAMPLES
http://www.screenulator.com/cgi-bin/v?pid=ref#reversal
Classic TA indicators and overlays: RSI, MACD, SMA, EMA, Bollinger, Keltner band, Donchian Channel, Parabolic SAR, Ichimoku Cloud, McGinley Dynamic, SuperTrend, stochastic, ADX, Aroon, Chaikin, Ultimate, MFI, OBV, ATR, ADL, CCI indicators. Fibonacci Retracement and text annotation tools. Others will available upon requests.
Note: This app is free trial for 2 weeks or 100 usages whichever comes first.
Instruction Manual: http://www.screenulator.com/ischarts_faq.html
Desktop version: http://www.screenulator.com/ischarts_desktop.html
About Interactive Stock Charts
Interactive Stock Charts is a free app for Android published in the Accounting & Finance list of apps, part of Business.
The company that develops Interactive Stock Charts is Screenulator.com. The latest version released by its developer is 2.86. This app was rated by 1 users of our site and has an average rating of 5.0.
To install Interactive Stock Charts on your Android device, just click the green Continue To App button above to start the installation process. The app is listed on our website since 2020-09-18 and was downloaded 45 times. We have already checked if the download link is safe, however for your own protection we recommend that you scan the downloaded app with your antivirus. Your antivirus may detect the Interactive Stock Charts as malware as malware if the download link to com.screenulator.ischarts is broken.
How to install Interactive Stock Charts on your Android device:
- Click on the Continue To App button on our website. This will redirect you to Google Play.
- Once the Interactive Stock Charts is shown in the Google Play listing of your Android device, you can start its download and installation. Tap on the Install button located below the search bar and to the right of the app icon.
- A pop-up window with the permissions required by Interactive Stock Charts will be shown. Click on Accept to continue the process.
- Interactive Stock Charts will be downloaded onto your device, displaying a progress. Once the download completes, the installation will start and you'll get a notification after the installation is finished.
